Regression models - What should I use?
By Saulo Gil
April 9, 2023
Regression models for quantitative outcomes
What should I use?
It is not uncommon situations in which we want to predict something. For issues in which we want to predict quantitative outcomes such as the price of a house in a specific area, which media are associated with sales, if is there a relationship between advertising budget and sales or the price of product, regression models may a useful tool to make this forecast task.
There are distinct regression models:
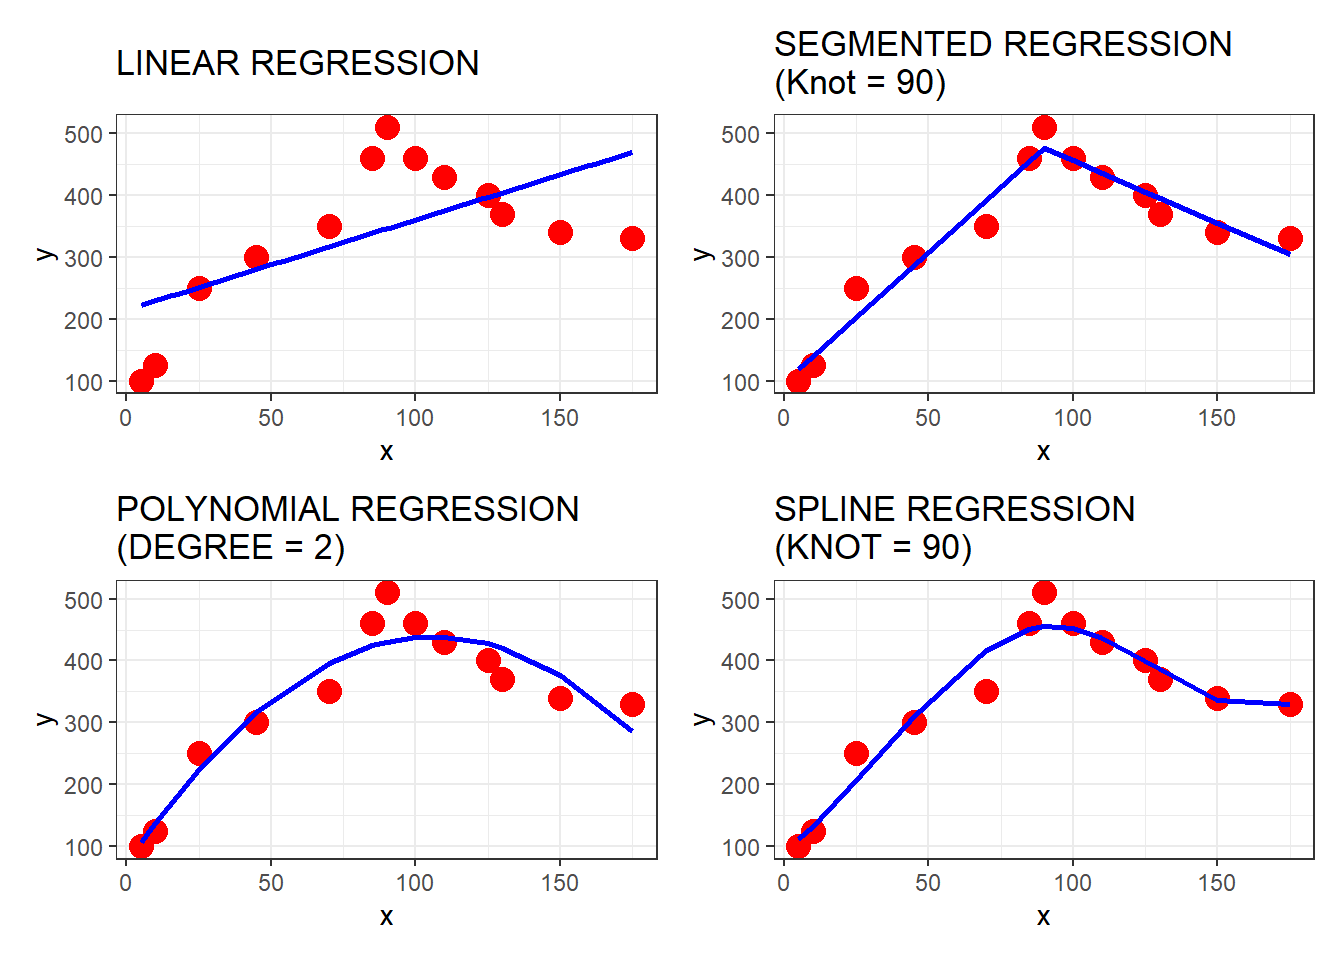
Linear;
Segmented;
Spline and;
Polynomial.
Let’s see the main characteristics of these models;
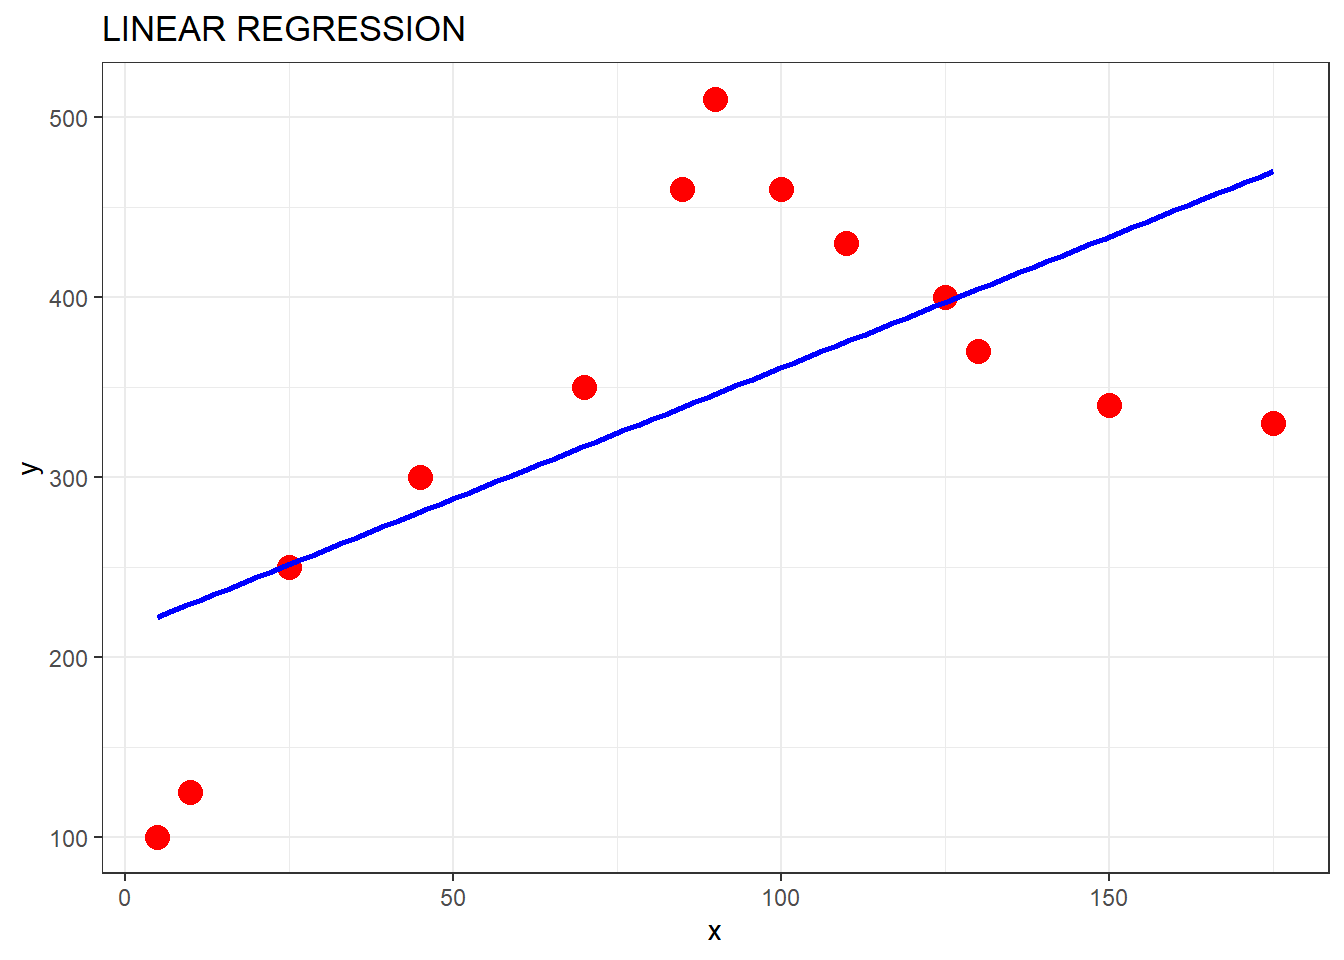
Linear Regression model
The most common regression model is Linear model. Linear regression models are widely used in various fields such as statistics, econometrics, social sciences, business, and machine learning, so on. It is a very simple statistical method, but a useful tool for predicting a quantitative outcome. A linear regression model is commonly used to model the relationship between two or more variables by fitting a linear equation to observed data.
Mathematically, we can write this linear relationship as:
\[ y = \beta_0 + \beta_1 X + \epsilon \]
Where,
y = outcome;
\(\beta_0\) = intercept (constant);
\(\beta_1\) = Slope;
\(X\) = Predictor (it is possible to have \(n\) predictors);
\(\epsilon\) = error
The goal of linear regression is to estimate the values of the regression coefficients (\(\beta_0, \beta_1...\beta_n\)) that best fit the observed data, typically using a method called least squares estimation. Once the regression coefficients are estimated, the linear regression model can be used to make predictions of the dependent variable based on the values of the independent variables.
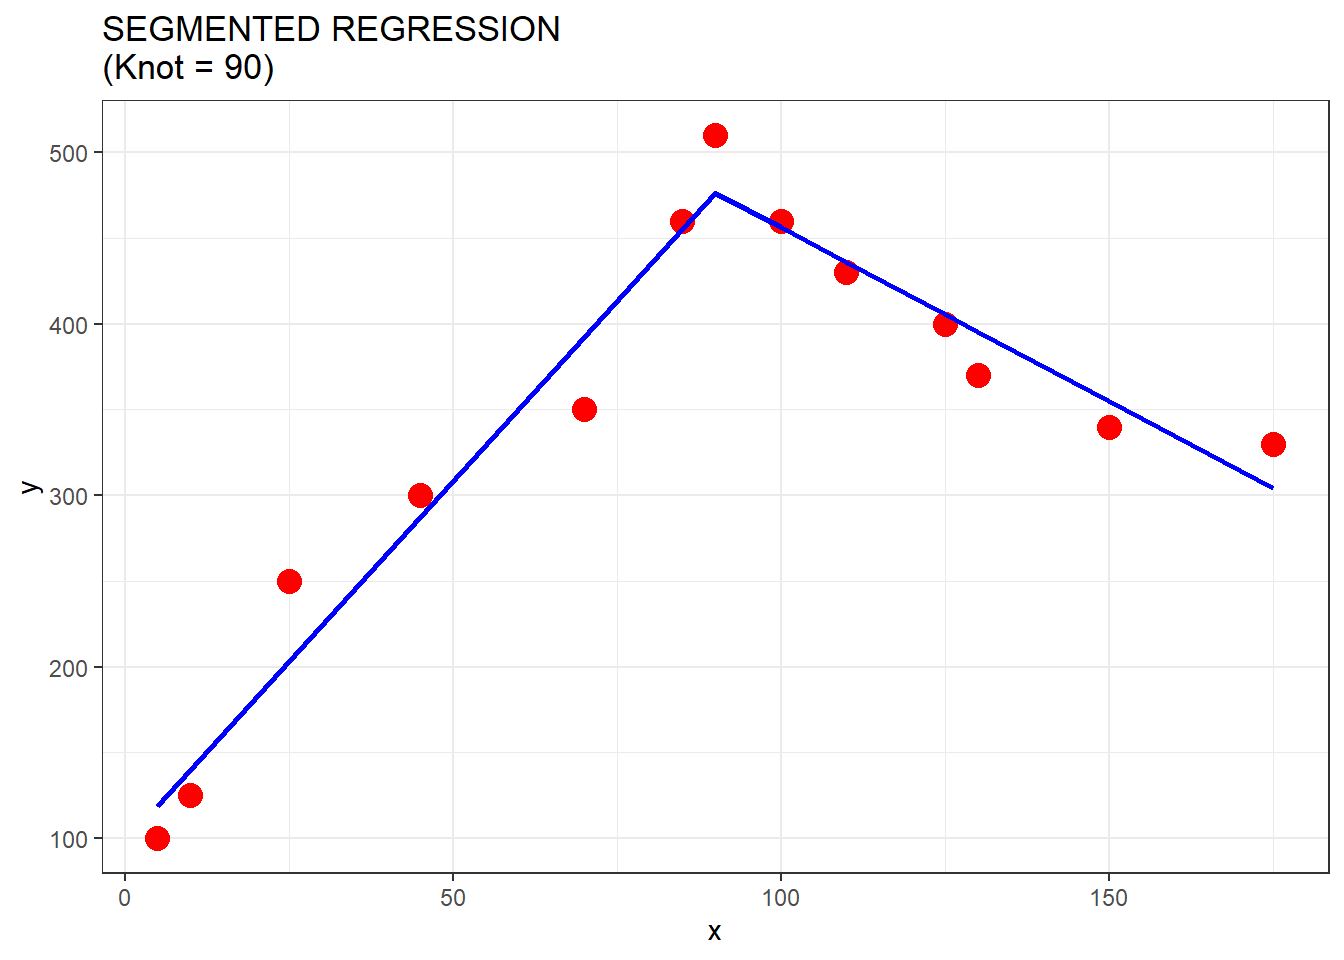
Segmented Regression model
A segmented regression model, also known as a piecewise regression model or a broken-stick regression model, is a type of regression model that allows for different linear relationships between variables in different segments or intervals of the data. It is used when there is evidence to suggest that the relationship between variables changes at specific points or breakpoints in the data.
A segmented regression model typically involves fitting different linear regression equations to different segments of the data, separated by breakpoints. The breakpoints represent the points at which the relationship between the variables changes. The segmented regression model can have one or more breakpoints, depending on the complexity of the relationship being modeled.
The equation for a segmented linear regression model can be represented mathematically as follows:
- In segment 1 (for values of the independent variable \(X\) less than the first breakpoint \(X_1\));
\[ y = \beta_0 + \beta_1 X + \epsilon \]
- In the segment 2 (for values of \(X\) greater than or equal to \(X_1\) and less than second breackpoint \(X_2\));
\[ y = \beta_0 + \beta_1 X_1 + \beta_2(X - X_2) + \epsilon \] - In the segment 3 (for values of \(X\) greater than or equal to \(X_2\) and less than second breackpoint \(X_3\));
\[ y = \beta_0 + \beta_1 X_1 + \beta_2(X_2 - X_1) + \beta_3(X - X_1) + \epsilon \] And so on, for each segment of the data with corresponding breakpoints \(X_1\),\(X_2\),\(X_3\),…, regression coefficients \(\beta_1\),\(\beta_2\),\(\beta_3\)…, and erro terms \(\epsilon_1\),\(\epsilon_2\),\(\epsilon_3\),…
The number of segments and breakpoints in a segmented linear regression model depends on the specific data and context of the analysis, and can be determined based on prior knowledge or through statistical methods, such as change-point detection techniques.
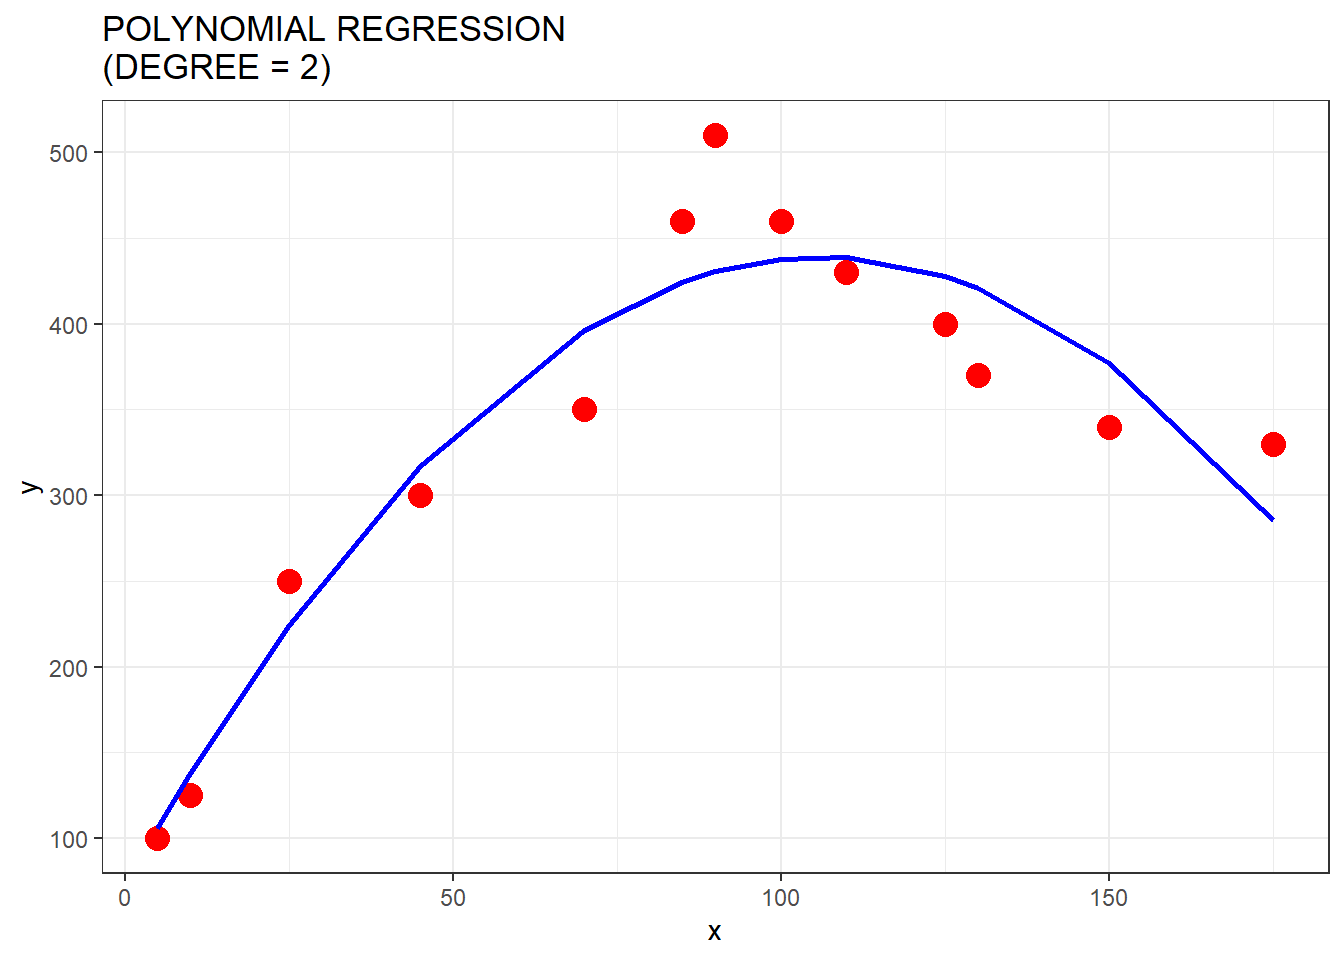
Polynomial Regression model
Polynomial regression is used to model the relationship between a predictor variable and a response variable using a polynomial function of a certain degree, rather than a straight line as in simple linear regression.
The equation for polynomial regression can be expressed as:
\[ y = \beta_0 + \beta_1X + \beta_2X^2 + \beta_3X^3 + ... + \beta_nX^n + \epsilon \]
Polynomial regression can be used to model various types of relationships between variables, including linear relationships (when the degree is 1), quadratic relationships (when the degree is 2), and higher-order relationships (when the degree is greater than 2). Polynomial regression can capture both upward and downward curvatures in the data, making it a flexible modeling technique for a wide range of data patterns.
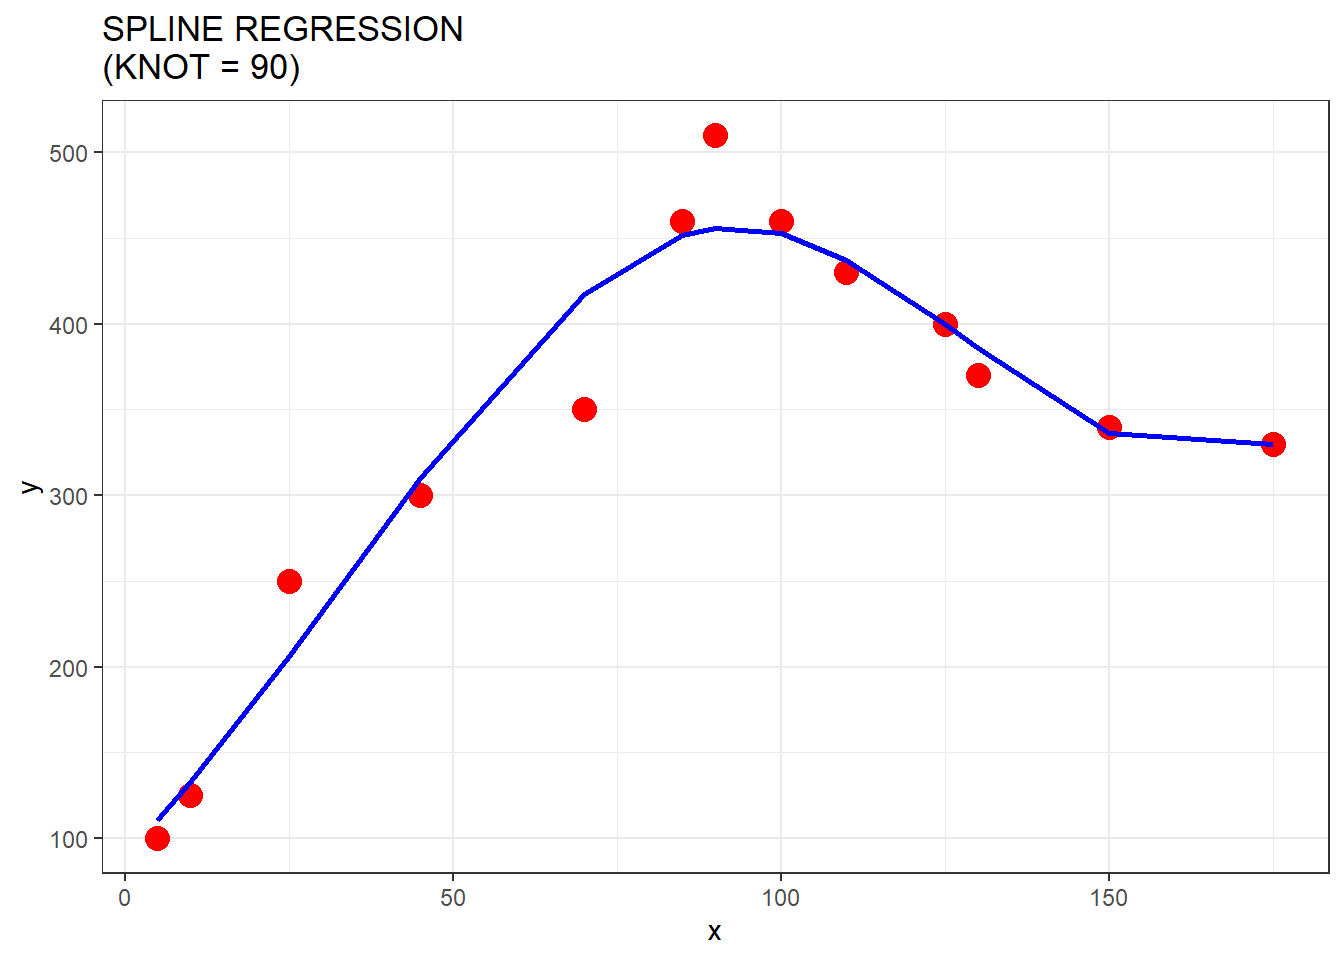
Spline Regression model
Similar to polynomial regression, Regression splines are also useful to capture nonlinear relationships between variables. They are a flexible and powerful method for fitting smooth curves to data that do not follow a linear pattern.
A regression spline works by dividing the range of a predictor variable (independent variable) into multiple segments or intervals, and then fitting a separate piecewise function or curve to each segment. These piecewise functions are typically polynomials of a low degree (e.g., linear or quadratic) within each segment, and they are joined together at specific points called knots. The knots are chosen in such a way that they allow for smooth transitions between the segments, resulting in a smooth overall curve.
There are various types of regression splines, such as natural splines, cubic splines, and B-splines, each with its own properties and characteristics.
A cubic spline with K knots can be modeled as:
\[ y = \beta_0 + \beta_1 b_1 (X) + \beta_2(X_2 - X_1) + \beta_3(X - X_1) + \epsilon_2 \]
As above mentioned, one of the advantages of using regression splines is that they can capture both linear and nonlinear patterns in the data, as the curves within each segment can have different shapes. This makes them more flexible than traditional linear regression, which assumes a constant relationship between variables.
WHAT IS THE BETTER?
Unfortunately (or fortunately), there is no WINNER when comparing regression models!❗️❗️❗️ All are useful and can be used for different issues and, therefore we should analyze the issue that we need to solve and choose the more appropriate regression model for those issues.
WARNING

This content is related to my studies in statistics and, thus it is not an academic reference. Please, more detailed information can be checked in the reference listed below.
Hope you enjoyed it!😜!

- Posted on:
- April 9, 2023
- Length:
- 5 minute read, 994 words
- See Also: