Incorporating Mask-Related Transmission Variability into SEIR Models to Analyze COVID-19 Curve-Flattening Strategies
By Saulo Gil
May 21, 2026
Incorporating Mask-Related Transmission Variability into SEIR Models to Analyze COVID-19 Curve-Flattening Strategies
📒 Introduction
Viral pandemics are not uncommon in human history, and their occurrence has increased in both frequency and impact over the past two decades, underscoring the vulnerability of an increasingly interconnected world to rapidly spreading pathogens. Since the early 2000s, successive outbreaks caused by novel or re-emerging viruses including severe acute respiratory syndrome coronavirus (SARS-CoV-1) in 2002–2003, the 2009 influenza A(H1N1) pandemic, Middle East respiratory syndrome coronavirus (MERS-CoV), Ebola virus disease, Zika virus infection, and most recently the coronavirus disease 2019 (COVID-19) pandemic driven by SARS-CoV-2, have repeatedly tested national health systems and the global governance architecture for health security (1-3). Although forecasting the spread of viruses is challenging, it can be useful for simulating different scenarios and thus improving preparedness for future epidemics.
In this scenario, mathematical models can be used to simulate and better understand the spread of infectious diseases. Among these, the SEIR framework is one of the most widely used to represent the dynamics of viral epidemics and pandemics in human populations. The SEIR model divides the population into four compartments: Susceptible (\(S\)), who are at risk of infection; Exposed (\(E\)), who have been infected but are not yet infectious (i.e., incubation period); Infectious (\(I\)), who can transmit the pathogen; and Recovered (\(R\)), who are no longer infectious and are assumed to have acquired immunity. Transitions between compartments are typically described by a system of differential equations that can be derived for corresponding difference equations (using Euler Method) to simulate the system using key parameters such as transmission rate (\(\lambda\)), which controls how quickly susceptible individuals become exposed; the progression rate from exposed to infectious named as incubation rate (\(\sigma\)), and the recovery rate (\(\delta\))] (4). By adjusting these parameters and initial conditions, SEIR models enable researchers to explore hypothetical scenarios such as the impact of mask-based interventions and to generate insights that can aid preparedness and response planning for future epidemics.
In this study, I simulated the spread of COVID-19 during the first wave (2020) by modeling transmission dynamics and incorporating different transmission rates associated with mask use. This allowed me to examine how mask-based interventions could help flatten the infection curve.
🛠️Methods
For modeling the spread of COVID-19 transmission during the first wave (2020), I considered four groups of individuals (compartments):
those susceptible to the disease (\(S\));
those exposed to the disease (\(E\));
those infected (\(I\)) and;
those who have recovered (\(R\)).
Other key parameters including infection rate (\(\lambda\)), recovery rate (\(\delta\)), incubation rate (\(\sigma\)), and the total population size (\(N\)) area also considered.
From these parameters, the system of differential equations can be written as follows:
\[ \begin{equation} \left\{ \begin{array}{rl} \frac{dS}{dt} & = & \frac{-\lambda S I}{N}\\ \\ \frac{dE}{dt} & = & \frac{-\lambda S I}{N} - \sigma E\\ \\ \frac{dI}{dt} & = & \sigma E - \delta I\\ \\ \frac{dR}{dt} & = & \delta I \end{array} \right. \end{equation} \]
where:
\(S(t)\) = number of susceptible individuals;
\(E(t)\) = number of exposed individuals (infected but not yet infectious);
\(I(t)\) = number of infectious individuals;
\(R(t)\) = number of recovered individuals;
\(N=S+E+I+R\) = size of population;
\(\lambda\) = transmission (infection) rate;
\(\delta\) = recovery rate;
\(\sigma\) = incubation rate, i.e., the rate at which exposed individuals become infectious;
Due to the high complexity of solving the differential equations, I derived the corresponding difference equations using the Euler method, enabling the numerical simulation of the biological system’s behavior. The system of difference equations can be written as follows
\[ \begin{equation} \left\{ \begin{array}{rl} S(t + \Delta t) & = & S(t) - \frac{\lambda}{N}S(t)I(t)\Delta t \\ \\ E(t + \Delta t) & = & E(t) + \Bigg(\frac{\lambda}{N}S(t)I(t) - \sigma E(t)\Bigg)\Delta t \\ \\ I(t + \Delta t) & = & I(t) + \Bigg(\sigma E(t) - \delta I(t)\Bigg)\Delta t \\ \\ R(t + \Delta t) & = & R(t) + \delta I(t) \Delta t \end{array} \right. \end{equation} \]
where:
\(\lambda\) is the transmission rate,
\(\sigma\) is the incubation rate,
\(\delta\) is the recovery rate, and
\(𝑁=𝑆(𝑡)+𝐸(𝑡)+𝐼(𝑡)+𝑅(𝑡)\).
Now, we can simulate the spread of a disease.
To simulate the transmission rate using the SEIR (Susceptible, Exposed, Infectious, Recovered) model, the following parameters were utilized: the rate of infection, the incubation period, the recovery rate, and the transmission rate. These parameters were derived from previous studies (5,6). The parameters are detailed in the table below.
The values for each parameter is showed above:
| Parameter | Symbol | Value | Description | Reference |
|---|---|---|---|---|
| Infection Rate - No mask | \(\lambda_{\text{No mask}}\) | 0.59 | Rate at which susceptible individuals become exposed | 5 |
| Infection Rate - Cloth mask | \(\lambda_{\text{Cloth mask}}\) | 0.42 (−30%) | Rate at which susceptible individuals become exposed | 6 |
| Infection Rate - Surgical mask | \(\lambda_{\text{Surgical mask}}\) | 0.30 (−50%) | Rate at which susceptible individuals become exposed | 6 |
| Infection Rate - N95 | \(\lambda_{\text{N95}}\) | 0.18 (−70%) | Rate at which susceptible individuals become exposed | 6 |
| Incubation Rate | \(\sigma\) | 1/5 days | Rate at which exposed individuals become infectious | 5 |
| Recovery Rate | \(\delta\) | 1/10 days | Rate at which infectious individuals recover | 5 |
| Sample Size (population of SP) | \(N\) | 11.9 million | Population of São Paulo | 5 |
The model was run for a total of 400 days, with initial conditions set for the number of susceptible (i.e., N - 1 individuals), exposed (i.e., 1 individuals), infectious (i.e., zero individuals), and recovered individuals (i.e., zero individuals), with a time step of 1 day. The value of \(N\) was set to 11.9 million (\(N\) = 1.19e7), which corresponds to the SP population.
🤖 Technologies Used
- Python 3
- Jupyter Notebook
- NumPy
- Matplotlib
📊Results
import numpy as np
import matplotlib.pyplot as plt

# Parameters
N = 1.19e7                           # total population
lambdas = [0.59, 0.42, 0.30, 0.18]   # transmission rates (no mask, cloth (-30%), surgical (-50%), N95 (-70%))
delta = 0.10                          # recovery rate (δ) ~ 10 days (1/10)
sigma = 0.20                          # incubation rate (σ) ~ 5 days (1/5)
Delta_t = 1                          # time step (days)
T = 400                              # total time (days)

# Time vector
t = np.arange(0, T, Delta_t)

# List to store all I curves
all_I = []

fig, axs = plt.subplots(2, 2, figsize=(12, 8))
axs = axs.ravel()

for idx, lambda_ in enumerate(lambdas):

    # Arrays for S, E, I, R
    S = np.zeros(len(t))
    E = np.zeros(len(t))
    I = np.zeros(len(t))
    R = np.zeros(len(t))

    # Initial conditions
    S[0] = N - 1 # First case in SP - 26 de fevereiro de 2020
    E[0] = 1
    I[0] = 0
    R[0] = 0

    # Euler iteration of discrete SEIR model
    for k in range(len(t) - 1):
        S[k+1] = S[k] - (lambda_ / N) * S[k] * I[k] * Delta_t
        E[k+1] = E[k] + ((lambda_ / N) * S[k] * I[k] - sigma * E[k]) * Delta_t
        I[k+1] = I[k] + (sigma * E[k] - delta * I[k]) * Delta_t
        R[k+1] = R[k] + delta * I[k] * Delta_t

    # Save I curve
    all_I.append(I)

    # Plot SEIR subplots
    ax = axs[idx]
    ax.plot(t, S, label="Susceptible (S)")
    ax.plot(t, E, label="Exposed (E)")
    ax.plot(t, I, label="Infected (I)")
    ax.plot(t, R, label="Recovered (R)")
    ax.set_title(f"λ = {lambda_}")
    ax.set_xlabel("Days")
    ax.set_ylabel("Population")
    ax.legend()
    ax.grid(True, alpha=0.6)

plt.tight_layout()
plt.show()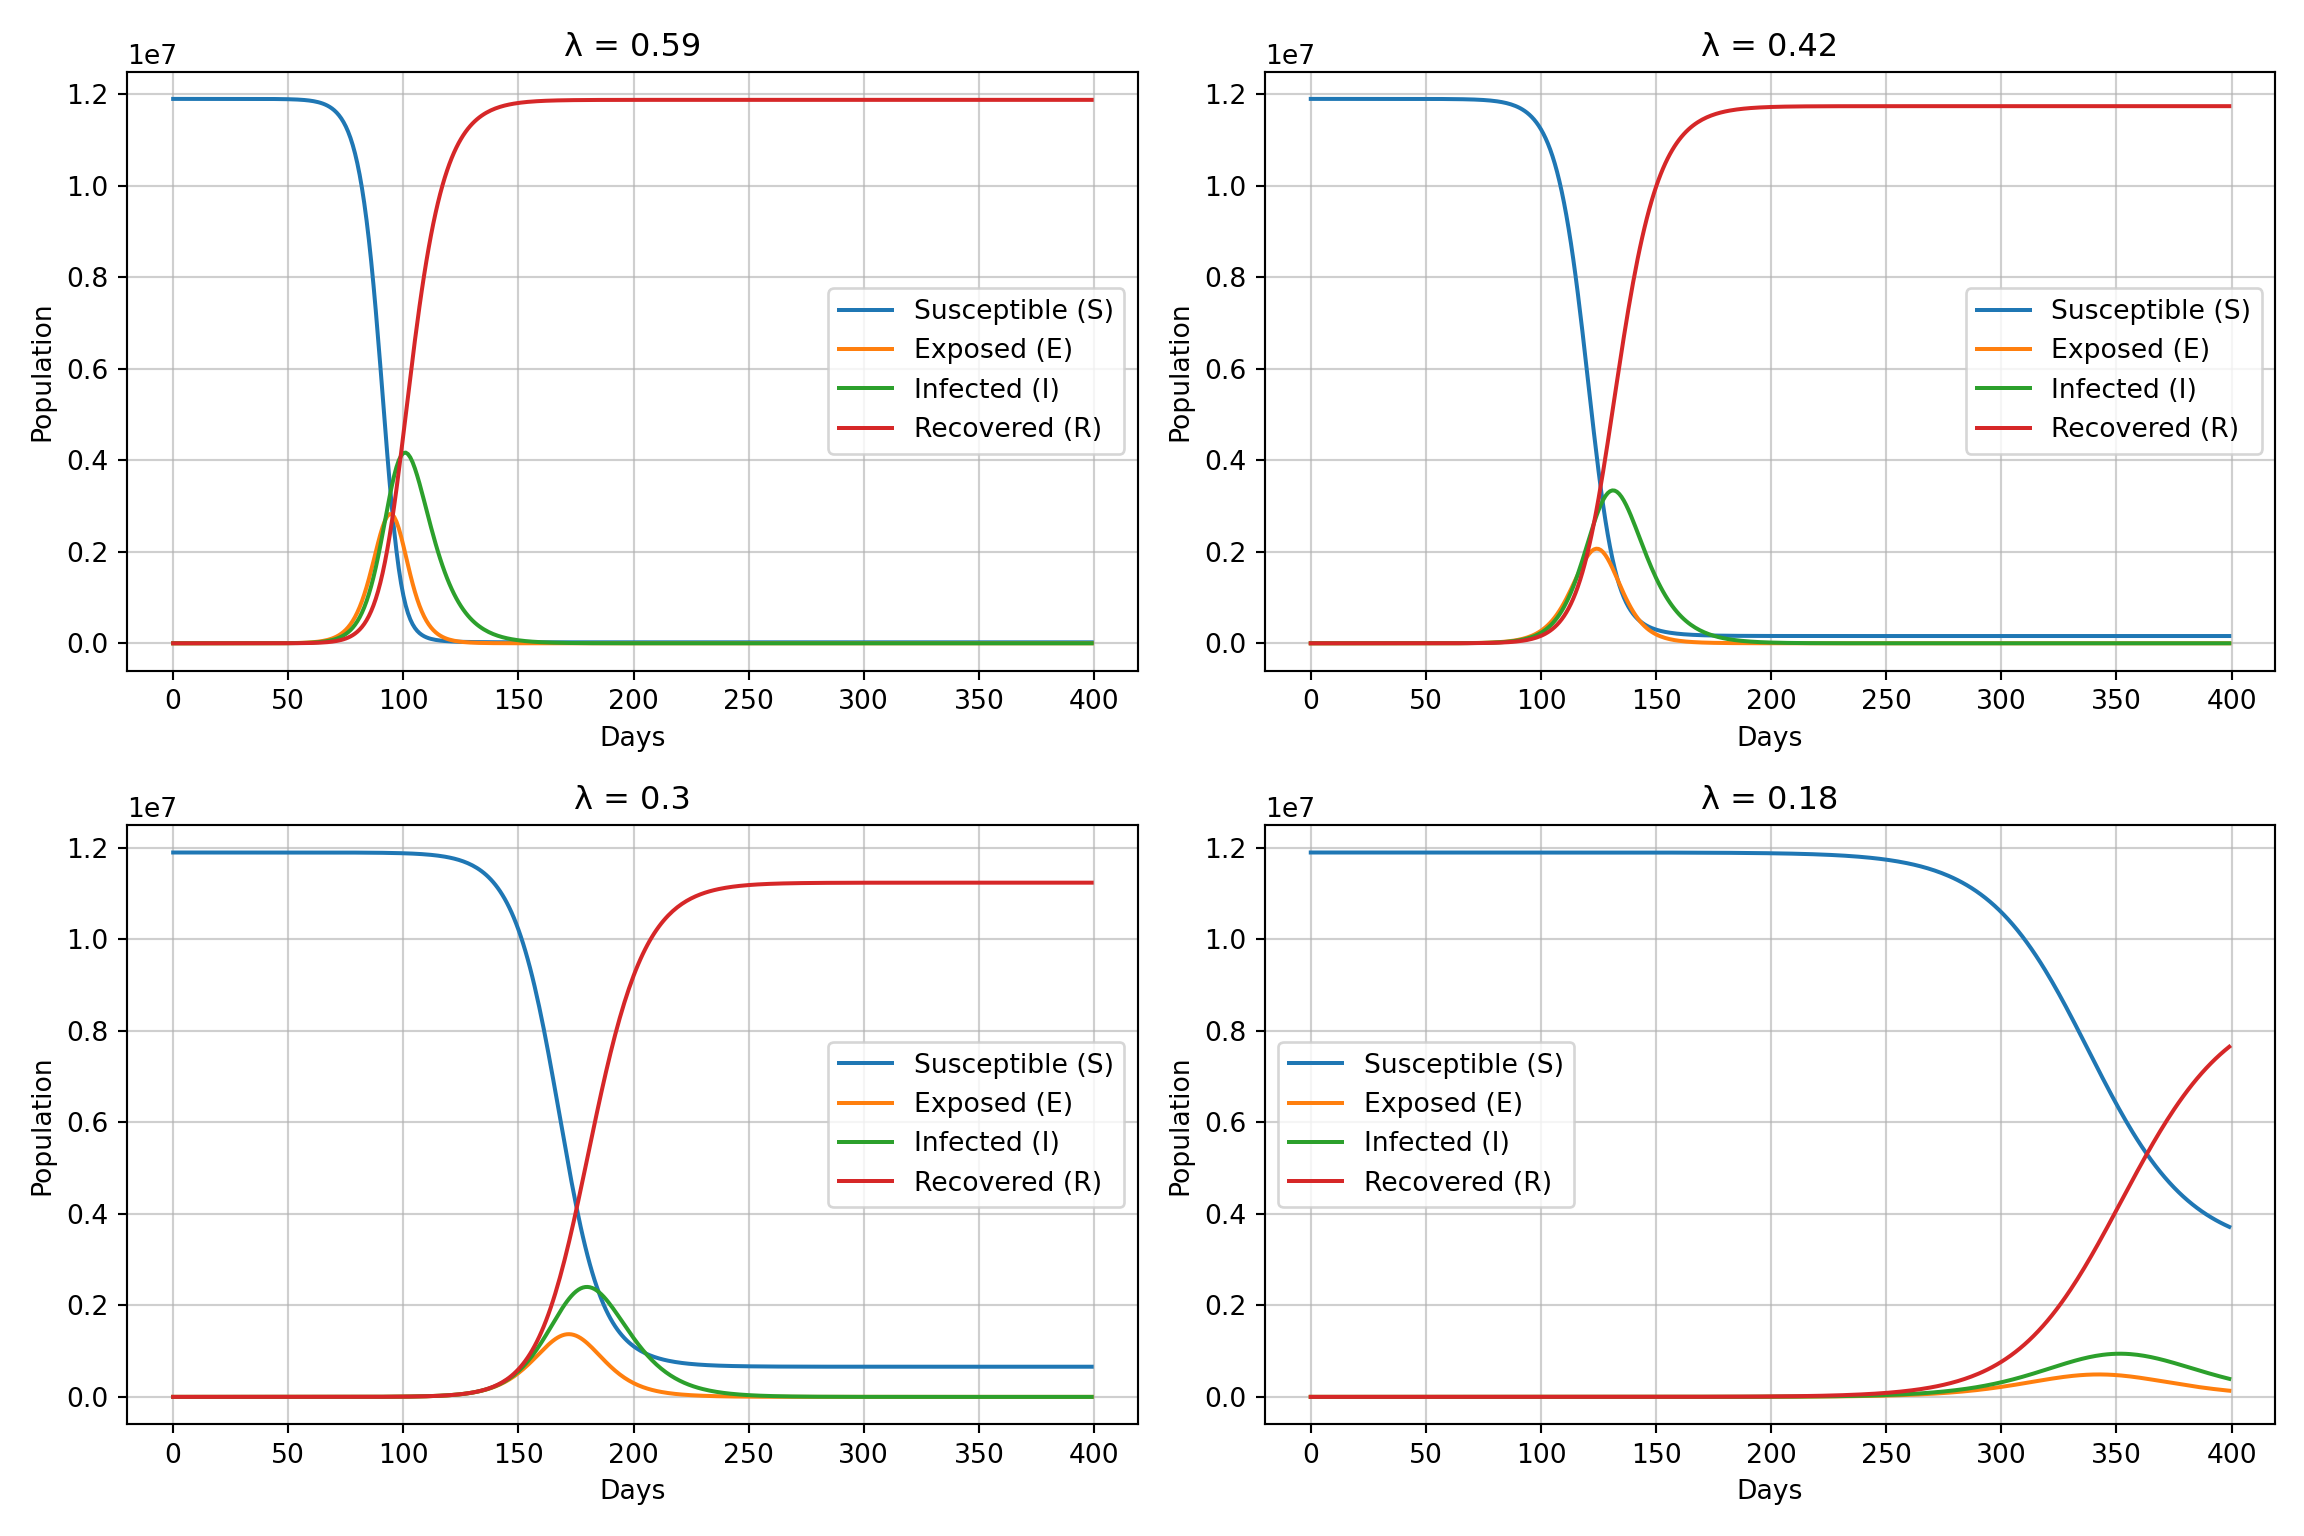
The four panels show the temporal evolution of the SEIR compartments for decreasing transmission rates (\(\lambda\) = 0.59, 0.42, 0.30, 0.18), which represent, respectively, no mask use, cloth masks, surgical masks, and N95/PFF2 masks.
In the scenario without masks (\(\lambda\) = 0.59), the number of infected individuals (I) rises very rapidly, producing an early and high peak, while the susceptible population (S) declines abruptly and the recovered compartment (R) quickly approaches the total population.
With cloth masks (\(\lambda\) = 0.42), the epidemic still grows quickly, but the peak of infected individuals (I) is already lower and slightly delayed. As more effective masks are introduced, i.e., surgical (\(\lambda\) = 0.30) and especially N95/PFF2 (\(\lambda\) = 0.18), both the exposed (E) and infected (I) curves become progressively lower and more spread out over time.
In the N95 condition, the infection curve is clearly flattened and delayed, indicating slower transmission, a substantially reduced maximum number of simultaneous infections, and consequently a lower potential burden on the healthcare system.
# All Infected Curves
plt.figure(figsize=(12, 8))

for I_curve, lambda_ in zip(all_I, lambdas):
    # Curva total de infectados
    plt.plot(t, I_curve, label=f"I(t) – λ={lambda_}", linewidth=2)

plt.title("Comparison of Infected Curves (I) for Different Transmission Rates (λ)")
plt.xlabel("Days")
plt.ylabel("Population")
plt.grid(True, alpha=0.6)

# # Hospital bed capacity line
# plt.hlines(y=121896, xmin=0, xmax=max(t), color='r', linestyle='--',
#            label='Número de leitos de urgência/emergência em SP')

plt.legend()
plt.tight_layout()
plt.show()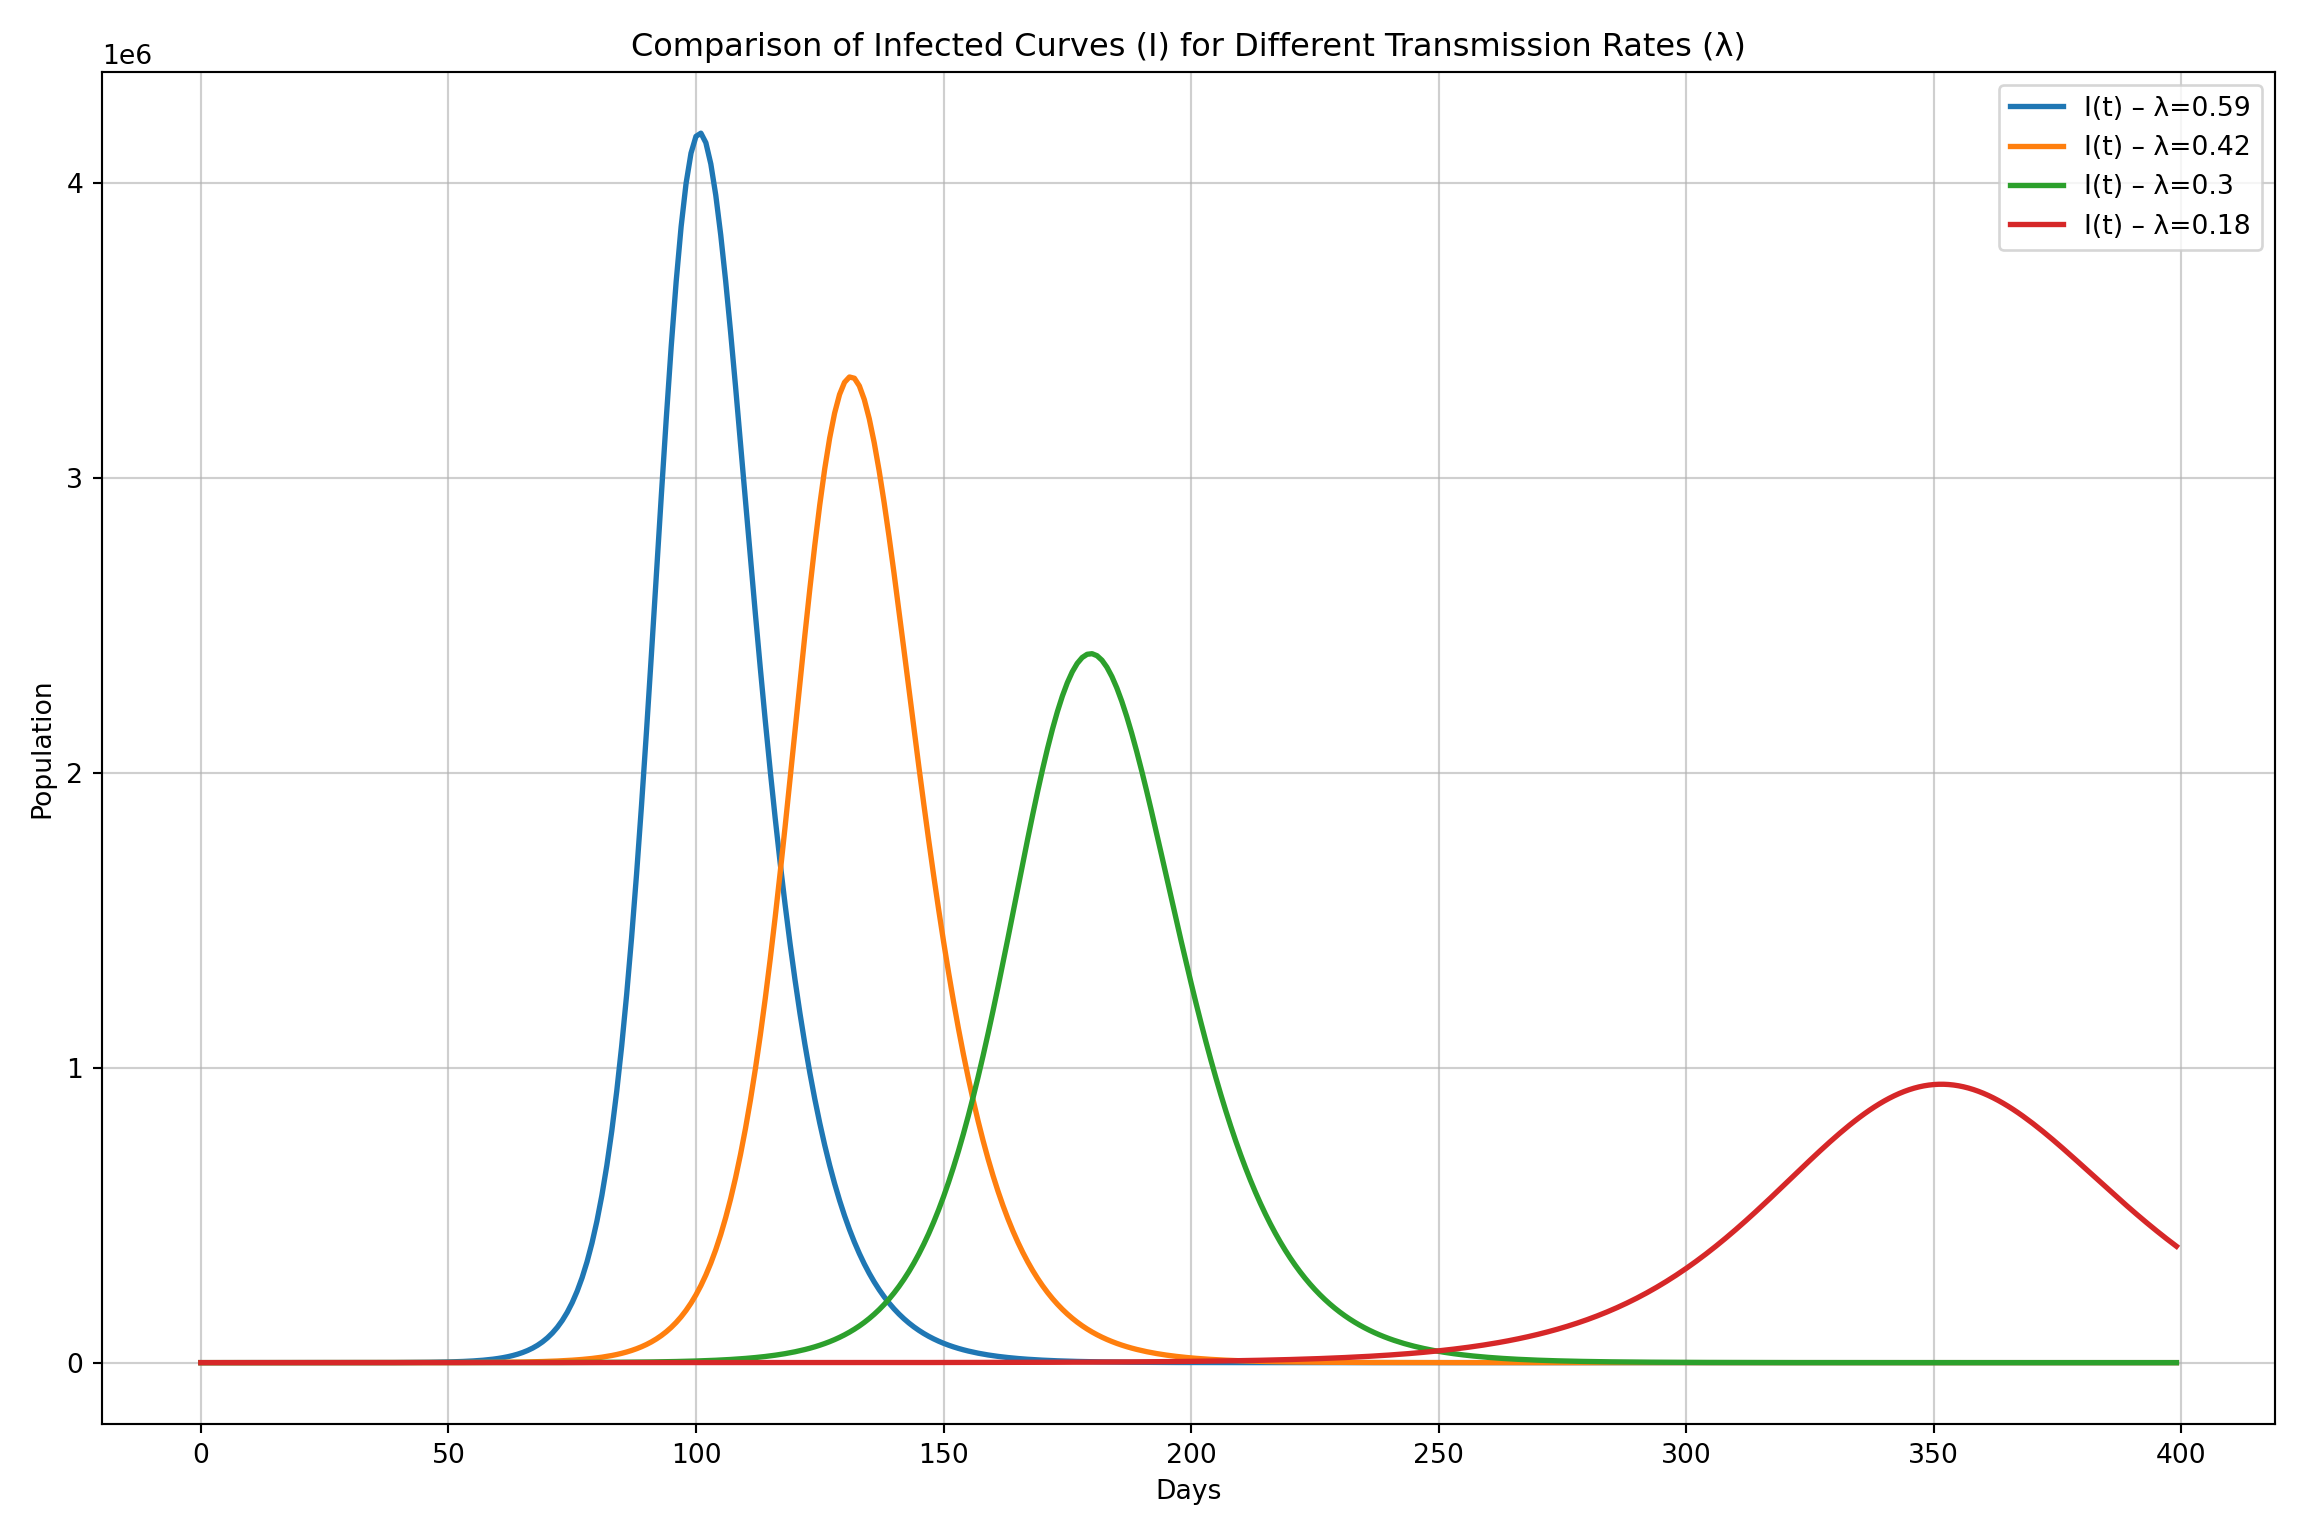
To demonstrate the transmission rate through mask use, I plotted only the infection curves in just a figure. The figure displays the isolated infection curves I(t) for the four transmission rates \(\lambda\)=0.59, 0.42, 0.30, 0.18, representing no mask, cloth, surgical, and N95/PFF2 use, respectively.
As shown in figure, as \(\lambda\) decreases the peak number of infected individuals becomes progressively lower and occurs later in time. Again, the scenario without masks (\(\lambda\)=0.59) exhibits a very sharp, early peak, whereas the N95/PFF2 scenario (\(\lambda\)=0.18) shows a much smaller and delayed peak. Therefore, this simulation highlights the potential benefits of mask use, particularly N95/PFF2 masks, in flattening the epidemic curve and thereby reducing the maximum instantaneous burden on health-care services
Although the total number of infected individuals is important, severe cases are critical because they require hospitalization and can rapidly push health systems to (or beyond) their maximum capacity. In this sense, I estimated the number of severe cases as 15% of all COVID-19 infections, in line with previous reports. Then, we added a horizontal dashed line indicating the number of rest/observation beds in emergency units as a indicator of the health-care system’s capacity, in order to assess whether mask use could help reduce the burden on the health-care system.
To obtain the number of rest/observation beds in emergency units, I used data from the National Registry of Health Establishments (CNES - Cadastro Nacional de Estabelecimentos de Saúde) available on basedosdados.org. This data was acessed using a SQL query in BigQuery (Google Cloud) on the basedosdados.br_ms_cnes.estabelecimento table using the code shown below (Figure).
SELECT
  SUM(
    dados.quantidade_leito_repouso_feminino_urgencia +
    dados.quantidade_leito_repouso_masculino_urgencia +
    dados.quantidade_leito_repouso_indiferenciado_urgencia +
  ) AS soma_total_leitos
FROM
    `basedosdados.br_ms_cnes.estabelecimento` AS dados
WHERE dados.sigla_uf = 'SP'
    AND dados.ano = '2020'

Finally, the infection rate across different mask-use scenarios, along with the total number of rest/observation beds in emergency units in São Paulo, is shown below.
# All Infected Curves
plt.figure(figsize=(12, 8))

for I_curve, lambda_ in zip(all_I, lambdas):
    # 15% dos infectados (ex.: casos que vão desenvolver sintomas graves)
    I_curve_15 = 0.15 * I_curve
    # Curva de 15% dos infectados
    plt.plot(t, I_curve_15, label=f"Severe Cases [15%·I(t)] – λ={lambda_}")

plt.title("Comparison of Infected Curves (I) for Different Transmission Rates (λ)\nSevere Cases (about 15% of infected)")
plt.xlabel("Days")
plt.ylabel("Population")
plt.grid(True, alpha=0.6)

# Hospital bed capacity line
plt.hlines(y=121896, xmin=0, xmax=max(t), color='r', linestyle='--',
           label='Number of emergency/urgent care beds in SP')

plt.legend()
plt.tight_layout()
plt.show()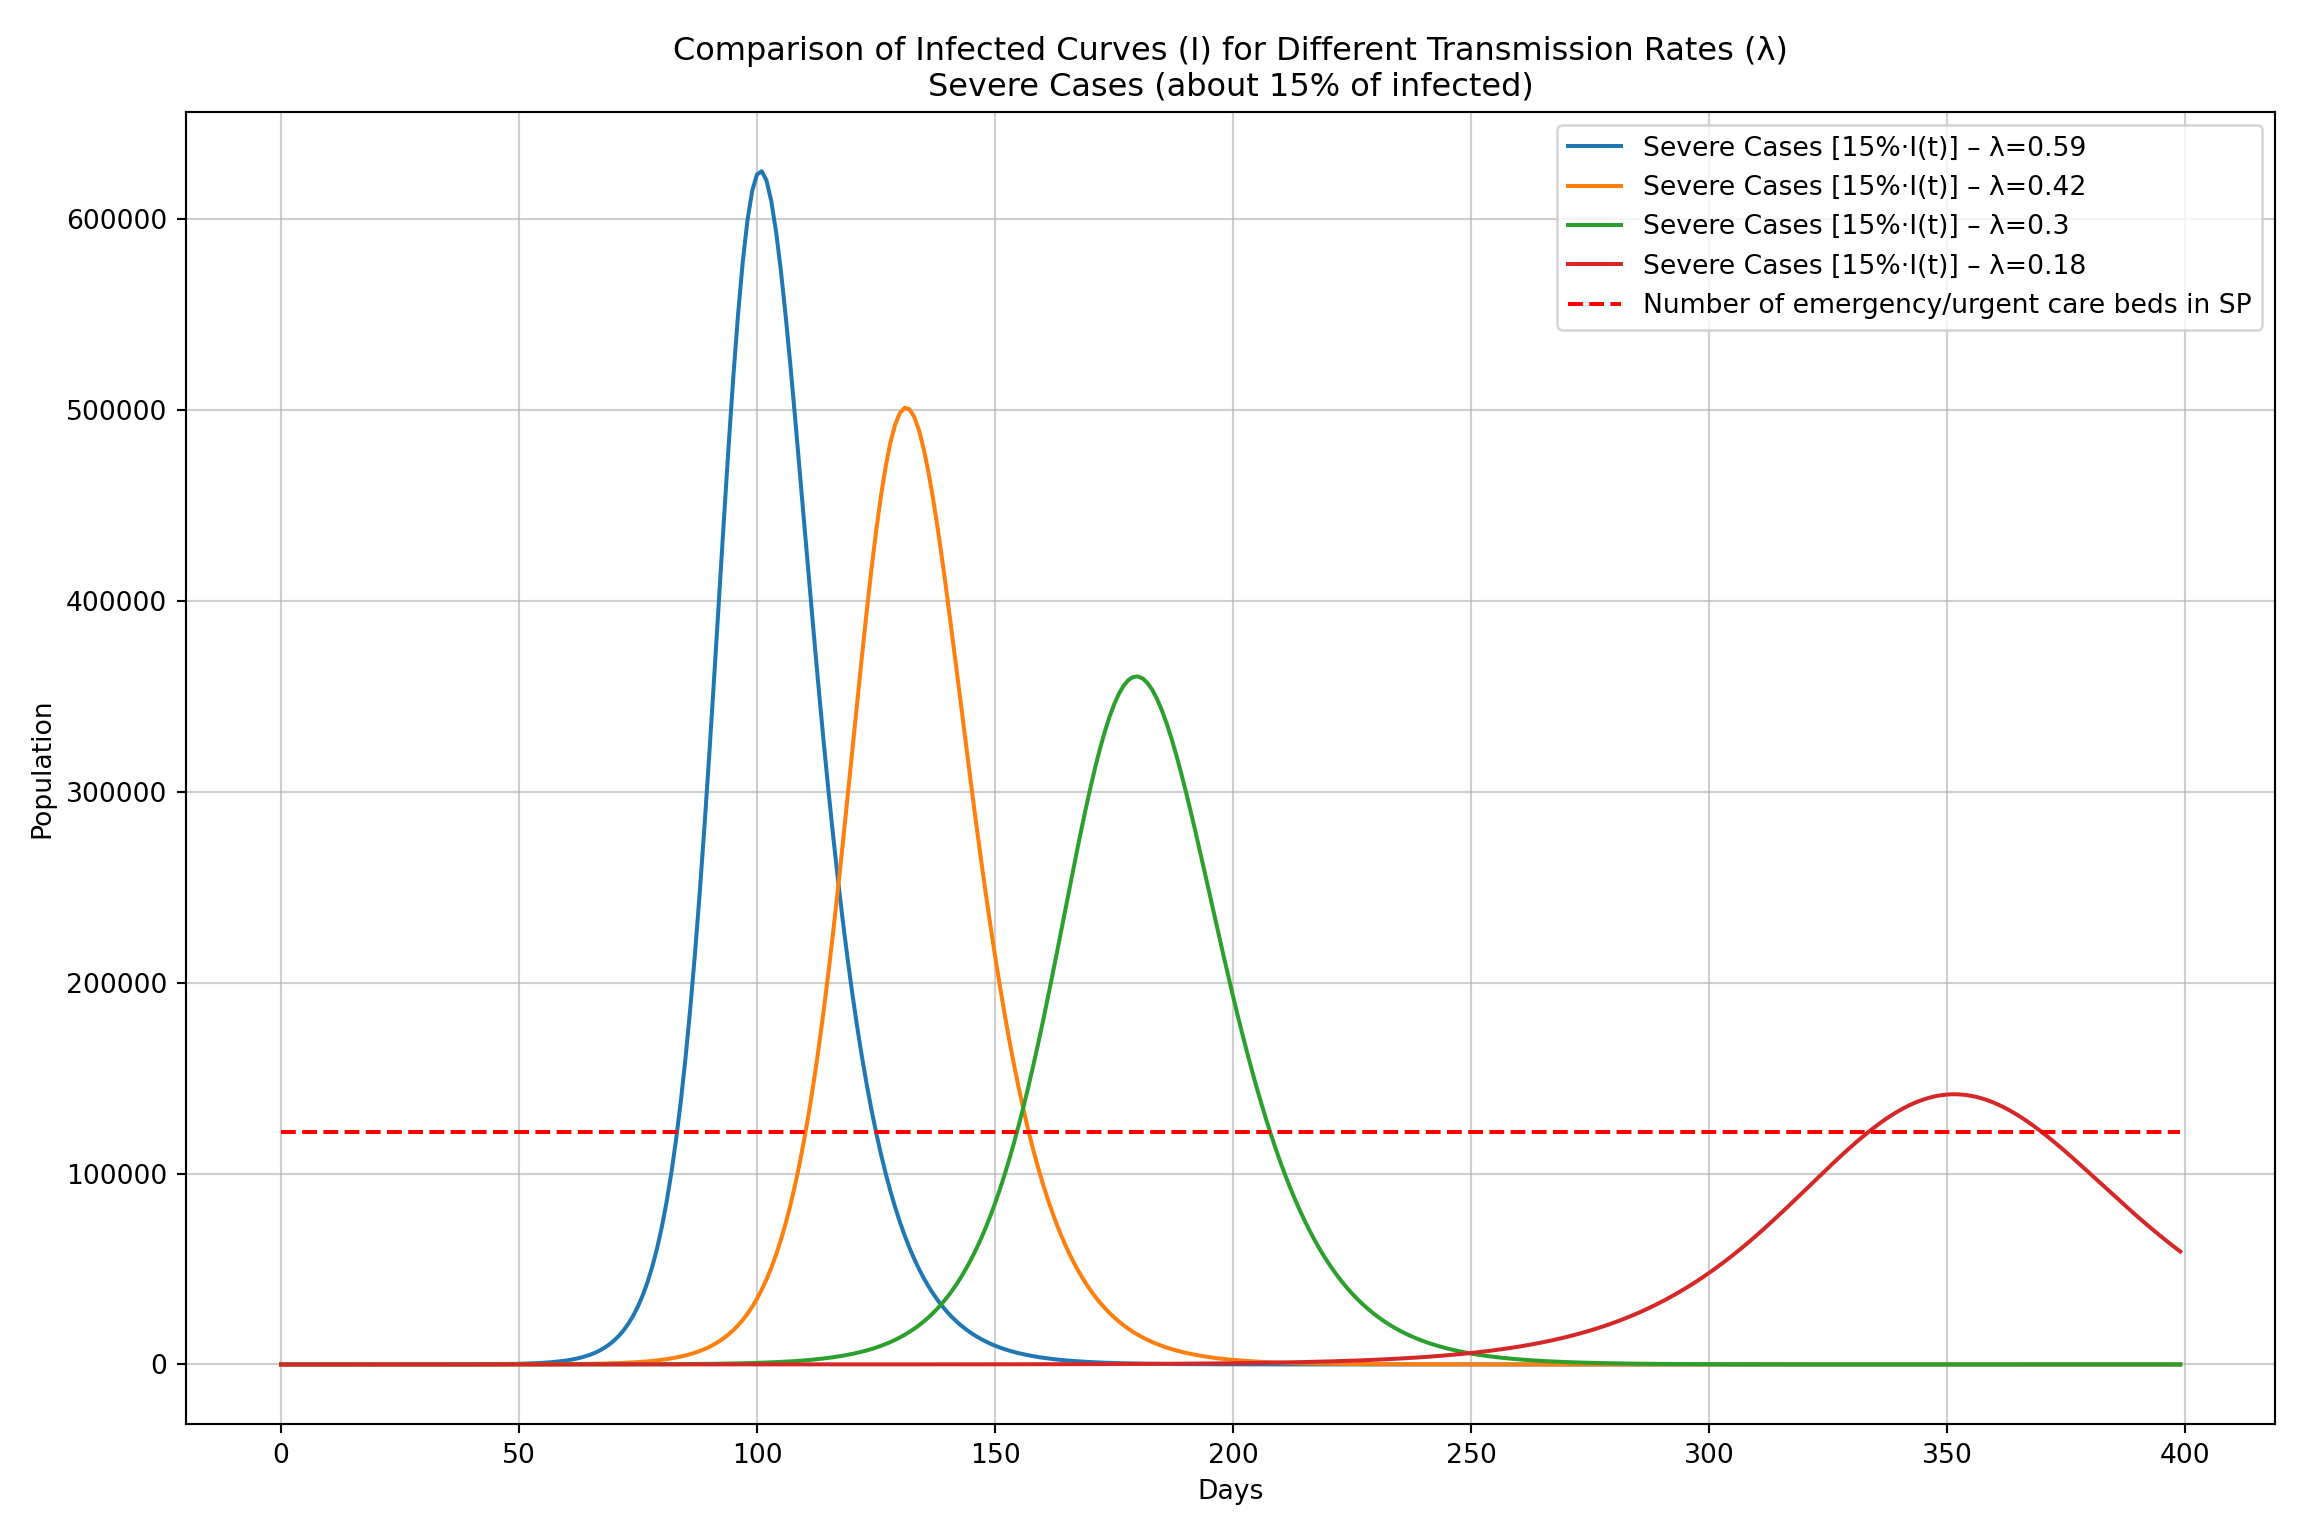
The simulation shows the estimated number of severe COVID-19 cases (\(\approx\) 15% of infections) over time for the four transmission rates (\(\lambda\) = 0.59, 0.42, 0.30, 0.18), together with a horizontal dashed line representing the total number of rest/observation beds in emergency units in São Paulo.
In the no-mask and cloth-mask scenarios (\(\lambda\) = 0.59 and 0.42), the peaks of severe cases are very high and occur early, far exceeding the available bed capacity. With surgical masks (\(\lambda\) = 0.30), the peak is lower and delayed, but still substantially above the health-care system capacity line. In contrast, under the N95/PFF2 scenario (\(\lambda\) = 0.18), the peak of severe cases is much smaller, occurs later in the epidemic, and lies close to the dashed capacity line.
This pattern indicates that only the high-efficiency N95/PFF2 masks are capable of flattening the curve of severe cases to a level approaching the existing emergency bed capacity, thereby markedly reducing the risk of health-system overload.
⚠️Limitations
Although SEIR framework is useful to explore hypothetical related to impact of mask-based interventions and to generate insights that can aid preparedness and response planning for future epidemics, some issues should be considered:
First, it assumes homogeneous mixing of the population, ignoring heterogeneity in contact patterns by age, occupation, household structure, or geography;
Second, model parameters such as transmission, incubation, and recovery rates are typically assumed to be constant or piecewise constant, which may not capture rapid changes in behavior, policy measures, viral variants, or health-care capacity over time;
Third, classical SEIR models are deterministic and do not incorporate stochastic effects that can be relevant, especially in the early phase of an outbreak or in smaller populations.
Fourth, the model usually assumes that recovered individuals acquire complete and lasting immunity, overlooking waning immunity, reinfections, and the impact of vaccination.
Finally, when SEIR models are used to evaluate interventions such as mask use, they often encode these effects as static reductions in the transmission rate, without explicitly accounting for imperfect adherence, incorrect use, or differences in risk across settings (e.g., households vs. workplaces).
Conclusion
Taken together, the SEIR simulations of the first COVID-19 wave suggest that reductions in the transmission rate associated with mask use substantially modify epidemic dynamics. As \(\lambda\) decreases from values representing no mask use to cloth, surgical, and finally N95/PFF2 masks, both the total number of infections and the peak prevalence of active cases are progressively reduced and delayed, demonstrating a clear flattening of the epidemic curve.
When severe cases are approximated as 15% of infections and compared with the number of rest/observation beds available in emergency units in São Paulo, only the N95/PFF2 scenario produces a peak of severe disease that approaches, rather than vastly exceeds, the existing capacity.
Although based on a simplified model and several assumptions, these findings reinforce the importance of high-efficacy masks as a non-pharmaceutical intervention capable of mitigating health-system overload during viral pandemics, particularly in the early phases when vaccines and specific treatments may not yet be widely available.
⚠️⚠️⚠️
This work was developed as part of the System Modeling and Simulation course in the Master’s Program in Information Engineering at UFABC, under the supervision of Prof. Luiz Henrique Bonani do Nascimento.
⚠️⚠️⚠️
References
Bhadoria P, Gupta G, Agarwal A. Viral Pandemics in the Past Two Decades: An Overview. J Family Med Prim Care. 2021;10(8):2745-50.
Morens DM, Fauci AS. Emerging Pandemic Diseases: How We Got to COVID-19. Cell. 2020;182(5):1077-92.
Wilder-Smith A. COVID-19 in comparison with other emerging viral diseases: risk of geographic spread via travel. Trop Dis Travel Med Vaccines. 2021;7(1):3.
Liu X. Analytical solution of l-i SEIR model-Comparison of l-i SEIR model with conventional SEIR model in simulation of epidemic curves. PLoS One. 2023;18(6):e0287196.
Pinto Neto O, Kennedy DM, Reis JC, Wang Y, Brizzi ACB, Zambrano GJ, de Souza JM, Pedroso W, de Mello Pedreiro RC, de Matos Brizzi B, Abinader EO, Zângaro RA. Mathematical model of COVID-19 intervention scenarios for São Paulo-Brazil. Nat Commun. 2021 Jan 18;12(1):418.
Floriano I, Silvinato A, Bacha HA, Barbosa AN, Tanni S, Bernardo WM. Effectiveness of wearing masks during the COVID-19 outbreak in cohort and case-control studies: a systematic review and meta-analysis. J Bras Pneumol. 2024 Jan 5;49(6):e20230003.
- Posted on:
- May 21, 2026
- Length:
- 12 minute read, 2476 words
- See Also: